Predicting the outcome of a League of Legends match 10 minutes into the game with 70% accuracy
11 Jul 2020
- Introductory remarks
- Retrieving data from MongoDB and data preprocessing
- Model definition and fitting
- Predicting Win/Loss
- Summary and discussion
- Appendix
- References
Predicting the outcome of a sports match just after a few minutes into the game is an intriguing topic. Wouldn’t it be great to know for certain that your favorite football team will win before the game is finished playing? Or betting on your Formula 1 driver to win and being right about it most of the time could earn you a lot of money. While this is not so easily done for regular sports, it can be done for games which heavily depend on the history of the current match, i.e., on things which happened before in the match. Our most promising candidate to develop a model for such a study is Riot Games’ League of Legends (LoL).
In this article we will show how to access data from a MongoDB which was fetched from Riot’s LoL API, how to process it so that it is usable for modeling, define useful features and how to train an eXtreme Gradient Boosting (XGBoost) model [1]. Using that model we will show that it is possible to predict the outcome of 5v5 Solo Queue match played on Summoner’s Rift after just 10 minutes into the match with 70 % accuracy. We will use data from game version 10.13.
The article is written in a hands-on way and we are going to show code examples. As a language of choice we took Python 3 with the libraries matplotlib [2], numpy [3], pandas [4], pymongo [5], seaborn [6], sklearn [7], xgboost [8].
Introductory remarks
League of Legends (LoL) is a multiplayer online battle arena (MOBA) game. Players compete in matches (in the mode we are looking at 5 vs 5) which can last from 20 to 50 minutes on average (see Appendix for more details on that). Teams have to work together to achieve victory by destroying the core building (called the Nexus) of the enemy team. Until they get there, they have to destroy towers and get past the defense lines of the enemy team without falling victim of losing their own Nexus in the process.
The players control characters called champions which are picked at the beginning of a match from a rich pool of different champions with their own set of unique abilities. During the match the champions will level up and gain additional abilities. They also have to accumulate gold to buy equipment. If a champion is killed it will not permanently die, but just removed from the battle field for a certain amount of time (which grows longer the longer the match is running).
To fetch the data we are using alolstats which provides functionality to fetch match data from Riot’s API and to store it in a MongoDB collection. It would also feature basic statistical calculations and provide a convenient REST API, but for this project only the ability to fetch and store match data is from importance.
The match data, besides other information, contains timeline information in 0-10 min, 10-20 min, 20-30 min and 30-end min slots for each participant (10 in total, 5 for each team) and we are going to use this data in the modeling approach as features. The prediction target is going to be if team 1 wins the game or now.
As a regression model we are going to use the XGBoost model [1] on approx. 50,000 matches.
Retrieving data from MongoDB and data preprocessing
Fetching data from a MongoDB is really simple with Python. With just a few lines of code you are receiving a cursor pointing to the data which can be used to iterate through the results. We are taking the results and put them directly into Pandas DataFrames, which may not be the best if we would have a very large collection, but it will do for our data set.
Fetching meta information about the matches from the MongoDB collection (we are filtering for the correct mapid, queueid and gameversion here) can be done via:
import pymongo
import pandas as pd

game_version = "10.13.326.4870"

connection = pymongo.MongoClient("mongodb://[redacted]:[redacted]@localhost/alolstats")
db = connection.alolstats

matches_meta = db.matches.aggregate([
    { "$match": {"gameversion": game_version, "mapid": 11, "queueid": 420}},
    { "$unset": ["teams","participants", "participantidentities"] },
])

df_matches_meta = pd.DataFrame(list(matches_meta))
df_matches_meta = df_matches_meta.set_index("gameid")
We will perform the same for the timeline data, but this needs a bit more effort as we have to flatten the embedded documents that we are receiving from our MongoDB collection:
def flatten_nested_json_df(df):
    # Thanks to random StackOverflow user for that piece of code
    df = df.reset_index()

    # search for columns to explode/flatten
    s = (df.applymap(type) == list).all()
    list_columns = s[s].index.tolist()

    s = (df.applymap(type) == dict).all()
    dict_columns = s[s].index.tolist()

    while len(list_columns) > 0 or len(dict_columns) > 0:
        new_columns = []

        for col in dict_columns:
            # explode dictionaries horizontally, adding new columns
            horiz_exploded = pd.json_normalize(df[col]).add_prefix(f'{col}.')
            horiz_exploded.index = df.index
            df = pd.concat([df, horiz_exploded], axis=1).drop(columns=[col])
            new_columns.extend(horiz_exploded.columns) # inplace

        for col in list_columns:
            # explode lists vertically, adding new columns
            df = df.drop(columns=[col]).join(df[col].explode().to_frame())
            new_columns.append(col)

        # check if there are still dict o list fields to flatten
        s = (df[new_columns].applymap(type) == list).all()
        list_columns = s[s].index.tolist()

        s = (df[new_columns].applymap(type) == dict).all()
        dict_columns = s[s].index.tolist()

    return df

df_matches_participant = []
for i in range(0,10,1):
    print("Fetching general infos for participant " + str(i+1) + " of 10")
    m = db.matches.aggregate([
        { "$match": {"gameversion": game_version, "mapid": 11, "queueid": 420}},
        { "$addFields": { "participants.gameid": "$gameid" } },
        { "$replaceRoot": { "newRoot": {"$arrayElemAt": [ "$participants", i] }  }  },
        { "$sort" : { "gameid" : 1, "participantid": 1 } },
    ], allowDiskUse = True )
    df_matches_participant.append(flatten_nested_json_df(pd.DataFrame(list(m))).set_index("gameid"))
We are ending up with data for each participant of the match, which we can further process to filter out only required columns and limit our features to only timeline fields for 0-10 min:
# Join all participants data into columns so that we have one line per game
X_participants = df_matches_participant[0].join(df_matches_participant[1], lsuffix="_p0", rsuffix="_p1")
for p in range(2,10,1):
    X_participants = X_participants.join(df_matches_participant[p], rsuffix="_p"+str(p))

X_participants_timeline_0_10 = X_participants.filter(regex=("teamid|timeline.*0-10.*"))

# Drop all Diffs between the players on the same lane, we do not want them
X_participants_timeline_0_10 = X_participants_timeline_0_10[X_participants_timeline_0_10.columns.drop(list(X_participants_timeline_0_10.filter(regex='diff')))]

y = pd.DataFrame(df_matches_team1[df_matches_team1["teamid"] == 100]["win"])
y.rename(columns={"win": "team1_did_win"}, inplace=True)
Xy = pd.concat([X_participants_timeline_0_10, y], axis=1)
Xy = X_participants_timeline_0_10.join(y)
Xy = Xy[Xy["team1_did_win"].isnull() == False]

# Final data set for prediction variable...
y_final= Xy["team1_did_win"]
# ... and for features, we drop all data sets were we do now know who one
X_final = Xy.drop('team1_did_win', axis=1)
The final data sets look like this now:
-
X_final (first 5 lines):
teamid_p0 timeline.creepspermindeltas.0-10_p0 timeline.xppermindeltas.0-10_p0 timeline.goldpermindeltas.0-10_p0 timeline.damagetakenpermindeltas.0-10_p0 teamid_p1 timeline.creepspermindeltas.0-10_p1 timeline.xppermindeltas.0-10_p1 timeline.goldpermindeltas.0-10_p1 timeline.damagetakenpermindeltas.0-10_p1 teamid timeline.creepspermindeltas.0-10 timeline.xppermindeltas.0-10 timeline.goldpermindeltas.0-10 timeline.damagetakenpermindeltas.0-10 teamid_p3 timeline.creepspermindeltas.0-10_p3 timeline.xppermindeltas.0-10_p3 timeline.goldpermindeltas.0-10_p3 timeline.damagetakenpermindeltas.0-10_p3 teamid_p4 timeline.creepspermindeltas.0-10_p4 timeline.xppermindeltas.0-10_p4 timeline.goldpermindeltas.0-10_p4 timeline.damagetakenpermindeltas.0-10_p4 teamid_p5 timeline.creepspermindeltas.0-10_p5 timeline.xppermindeltas.0-10_p5 timeline.goldpermindeltas.0-10_p5 timeline.damagetakenpermindeltas.0-10_p5 teamid_p6 timeline.creepspermindeltas.0-10_p6 timeline.xppermindeltas.0-10_p6 timeline.goldpermindeltas.0-10_p6 timeline.damagetakenpermindeltas.0-10_p6 teamid_p7 timeline.creepspermindeltas.0-10_p7 timeline.xppermindeltas.0-10_p7 timeline.goldpermindeltas.0-10_p7 timeline.damagetakenpermindeltas.0-10_p7 teamid_p8 timeline.creepspermindeltas.0-10_p8 timeline.xppermindeltas.0-10_p8 timeline.goldpermindeltas.0-10_p8 timeline.damagetakenpermindeltas.0-10_p8 teamid_p9 timeline.creepspermindeltas.0-10_p9 timeline.xppermindeltas.0-10_p9 timeline.goldpermindeltas.0-10_p9 timeline.damagetakenpermindeltas.0-10_p9 gameid 317415113 100 1.5 230.2 157.1 318.2 100 0.0 377.4 324.2 849.2 100 6.1 266.1 230.2 341.0 100 6.3 368.7 281.9 663.4 100 7.2 431.5 258.7 482.1 200 5.4 398.7 233.3 492.3 200 7.3 511.6 388.1 450.8 200 7.8 330.8 443.3 351.9 200 0.1 335.3 342.0 776.1 200 1.3 328.2 235.2 205.3 317416566 100 7.6 338.3 263.9 205.6 100 0.3 274.1 155.2 171.7 100 4.6 354.8 200.6 419.5 100 0.2 260.6 230.4 441.6 100 8.3 499.8 394.3 385.4 200 7.0 299.2 240.6 157.8 200 0.1 278.3 132.2 153.1 200 3.7 371.2 201.5 502.1 200 8.3 517.9 335.8 211.8 200 0.5 298.1 258.8 694.8 317418523 100 5.9 314.5 215.4 397.8 100 7.4 481.4 259.2 146.6 100 0.0 310.0 307.0 758.9 100 0.7 218.8 153.1 241.2 100 5.0 398.7 196.5 434.8 200 7.3 489.0 304.2 399.2 200 1.3 263.4 201.9 269.0 200 6.8 425.8 301.1 287.3 200 0.6 364.5 365.7 576.5 200 9.0 352.6 353.6 259.6 317419849 100 7.3 423.2 249.0 395.0 100 0.0 276.4 144.3 24.8 100 6.9 298.6 270.8 268.5 100 0.4 311.2 358.8 864.9 100 5.9 461.4 400.6 519.4 200 1.2 241.1 167.3 219.3 200 7.5 344.2 292.1 252.3 200 3.9 348.6 237.9 635.3 200 0.2 373.8 366.0 616.8 200 6.1 435.1 315.6 148.0 317425382 100 0.2 183.0 177.8 250.7 100 7.5 499.0 304.2 436.4 100 0.2 344.9 348.8 671.2 100 7.0 444.3 235.5 310.3 100 4.0 341.9 385.6 438.5 200 0.4 362.0 269.1 676.1 200 0.8 271.6 286.5 334.9 200 5.7 273.7 290.1 550.2 200 3.8 365.2 177.4 485.9 200 8.4 539.3 294.1 284.2 -
y_final (first 5 lines):
  gameid
  317415113    Fail
  317416566    Fail
  317418523    Fail
  317419849    Fail
  317425382    Fail
  Name: team1_did_win, dtype: object
We want to split our data set into training, validation and test sets, to validate the model and to later on test the model on test data. This can be easily accomplished with sklearn train_test_split function:
from sklearn.model_selection import train_test_split
X_tmp, X_test, y_tmp, y_test = train_test_split(X_final, y_final, train_size=0.8, test_size=0.2, random_state = 0)
X_train, X_valid, y_train, y_valid = train_test_split(X_tmp, y_tmp, train_size=0.8, test_size=0.2, random_state = 0)
del X_tmp, y_tmp
No data set is perfect and there are NaN values in the data sets and we have to fill them (the other possibility would be to drop the columns entirely, but we would lose a lot of data). It turns out that Riot seems to set certain fields to NaN if they could not determine certain metrics for a player in that time frame. It is clear that it will not be normally distributed data and we should not use the mean to fill the missing data points. It would be a possibility to take the median to fill the data, but even better works to just set the value to zero. We will use the sklearn SimpleImputer to perform this step:
from sklearn.impute import SimpleImputer

my_imputer = SimpleImputer(strategy='constant', fill_value=0.0)
imputed_X_train = pd.DataFrame(my_imputer.fit_transform(X_train))
imputed_X_valid = pd.DataFrame(my_imputer.transform(X_valid))
imputed_X_test = pd.DataFrame(my_imputer.fit_transform(X_test))

# Imputation removed column names; put them back
imputed_X_train.columns = X_train.columns
imputed_X_valid.columns = X_valid.columns
imputed_X_test.columns = X_test.columns

# Imputation removed indices; put them back
imputed_X_train.index = X_train.index
imputed_X_valid.index = X_valid.index
imputed_X_test.index = X_test.index
The last step left to do is to encode our prediction target, which is “Win” or “Fail”, to something numeric which can be used in our model. We perform this encoding with the LabelEncoder:
from sklearn.preprocessing import LabelEncoder
label_encoder = LabelEncoder()
label_y_train = label_encoder.fit_transform(y_train)
label_y_valid = label_encoder.transform(y_valid)
Model definition and fitting
The features we are going to use for the model are now
| Feature | Description |
|---|---|
| Team id | The Team ID of that participant (either 100 or 200). |
| Creeps per minute 0-10min | The NPC creatures killed per minute during the time of 0 to 10 minutes into the game. |
| Gold per minute 0-10min | The gold earned per minute during the time of 0 to 10 minutes into the game. |
| Damage taken per minute 0-10min | Damage taken per minute during the time of 0 to 10 minutes into the game. |
These features will occur 10 times in our data set, once for each player in the match.
We define two functions, one for the model and one for judging the quality of the model:
from sklearn.ensemble import RandomForestRegressor
from sklearn.metrics import mean_absolute_error
from xgboost import XGBRegressor

def fit_xgboost_model(X_train, y_train, X_valid, y_valid, learning_rate=0.01, n_estimators=500, early_stopping_rounds=5):
    model = XGBRegressor(n_estimators=n_estimators, learning_rate=learning_rate, n_jobs=8)
    model.fit(X_train, y_train,
              early_stopping_rounds=early_stopping_rounds,
              eval_set=[(X_valid, y_valid)],
              verbose=False
             )
    return model

def score_dataset(model, X_valid, y_valid):
    preds = model.predict(X_valid)
    return mean_absolute_error(y_valid, preds)
To find the best XGB parameters we are looping over number of estimators (n_estimators) and learning rate (learning_rate) and find the parameters which minimize the mean absolute error.
import numpy as np

best_learning_rate = 0
best_n_estimators = 0
best_mae = 100000
for learning_rate in np.arange(0.004, 0.05, 0.002):
    for n_estimators in np.arange(400, 1600, 200):
        model = fit_xgboost_model(imputed_X_train, label_y_train, imputed_X_valid, label_y_valid, learning_rate, n_estimators)
        mae = score_dataset(model, imputed_X_valid, label_y_valid)
        if mae < best_mae:
            best_learning_rate = learning_rate
            best_n_estimators = n_estimators
            best_mae = mae
The best parameters for the data set used in this study were learning_rate = 0 and n_estimators = 0 and we kept the early stopping rounds at a value of 5.
Using these parameters we perform one final fit of the model which we are going to use for prediction on the test set.
model = fit_xgboost_model(imputed_X_train, label_y_train, imputed_X_valid, label_y_valid, best_learning_rate, best_n_estimators)
Predicting Win/Loss
As we know the real outcome of the matches in the test set, we can compare the predictions
preds_test = model.predict(imputed_X_test)
with the actual results
output = pd.DataFrame({"gameid": imputed_X_test.index, "team1_did_win": preds_test})
output["team1_did_win"] = output["team1_did_win"] > 0.5
output = output.set_index("gameid")
and calculate the accuracy of our predictions
check = output.join(y_test, lsuffix="_pred", rsuffix="_test")
check["team1_did_win_test"] = (check["team1_did_win_test"] == "Win")

check["equal"] = check["team1_did_win_test"] == check["team1_did_win_pred"]
test_pred_accuracy_percent = len(check[check["equal"] == True]) / len(check) * 100
print("The accuracy on the test set is " + str(test_pred_accuracy_percent) + " %")
The accuracy on the test set is 70.67495737639153 %
As can be seen, we are able to reach an accuracy of 70 % with that simple modeling approach by just taking into account data from the first 10 minutes of the match. This is quite remarkable as it means we are able to correctly predict the outcome of a match after the first 10 minutes more than 2 out of 3 times.
Summary and discussion
We used the Riot Games API to fetch match data for approx. 50,000 matches for game version 10.13 5v5 Solo Queue on Summoner’s Rift. From the fetched match data we extracted features for the first 10 minutes of the match. Using these features we were able to train a model which can predict the winner of the game to an accuracy of 70%, by just looking at the first 10 minutes of that match.
Appendix
We will take a look at additional metrics which are part of the match data we fetched. We are especially interested in the win rate based on firsts in the match.
Towers are important defensive structures in the game and losing one opens up the possibilities for the other team. As can be seen in the next figure, it can indeed be relevant to lose the first tower.
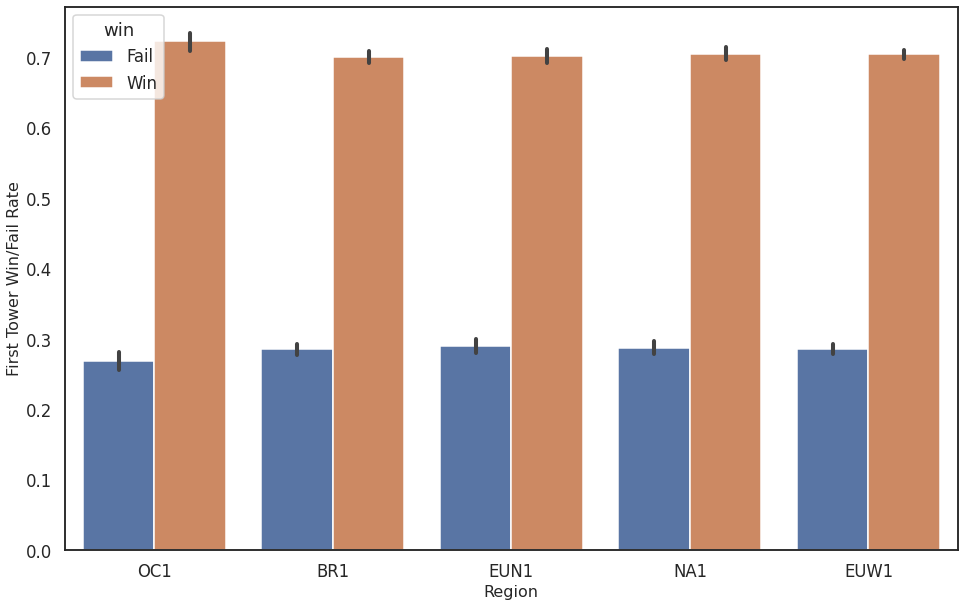 Figure 1: First Tower Win vs Fail for different regions
Now it can of course be also interpreted that the result of all what happened before in the match tilted the match into one teams favor making it easier for them to take out a tower. Nevertheless, it can be shown that the win chance and the first tower kill is highly correlated.
In addition, Baron is a very important objective in the game. Not only does it provide a large boost for the team taking it, but it usually also indicates that the match is already going in the favor of that team. In the Win/Fail rate for first Baron kill there is a clear tendency to Win for the team taking the Baron and it is nearly impossible to turn a match if the opposite team takes a Baron.
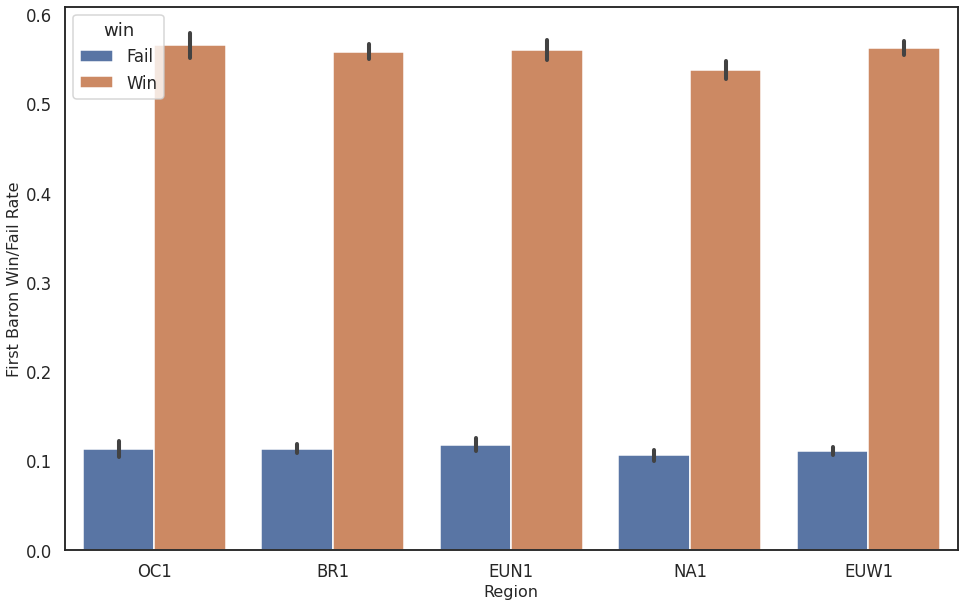 Figure 2: First Baron Win vs Fail for different regions
Note: Here the Win/Fail rates do not sum up to 100%, as there are games were neither team takes the Baron. In an extended analysis one should only take matches were the Baron has been taken into consideration for that plot. Nevertheless, it is clear from these numbers, that it is quite hard to turn a game if the opposing team was able to secure the first Baron of the match.
The dragon is an earlier objective and usually not that important in the outcome of a match. Nevertheless, also here it can be seen that getting the first dragon indicates that that team is on a good way to end the match victorious:
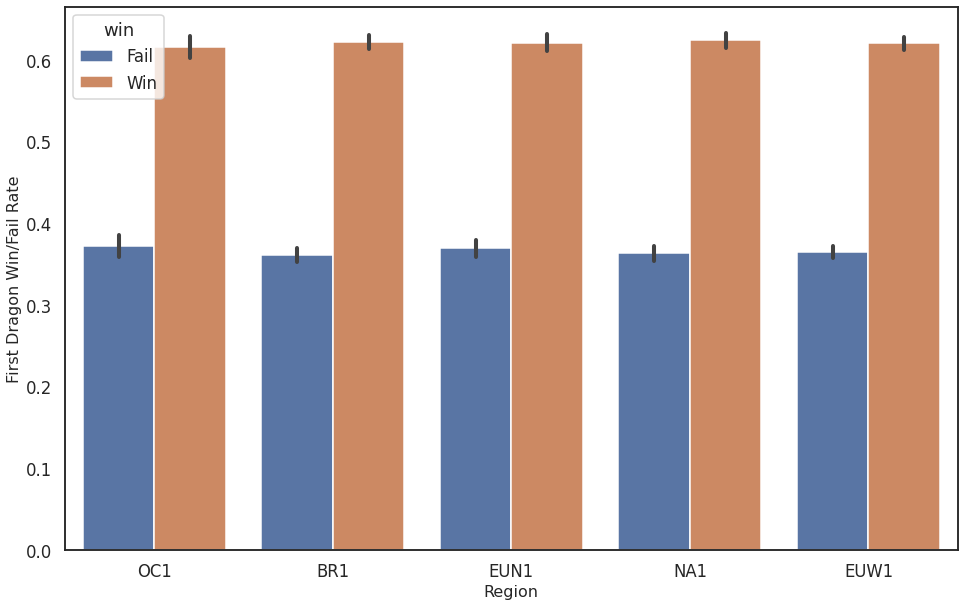 Figure 3: First Dragon Win vs Fail for different regions
The first blood of the match (who killed the a champion of the enemy team first) can happen quite early in a match and from all the investigated metrics this one is the one which does not indicate if a team will win or not that clearly. It seems to be still an indication what team is going to win, however:
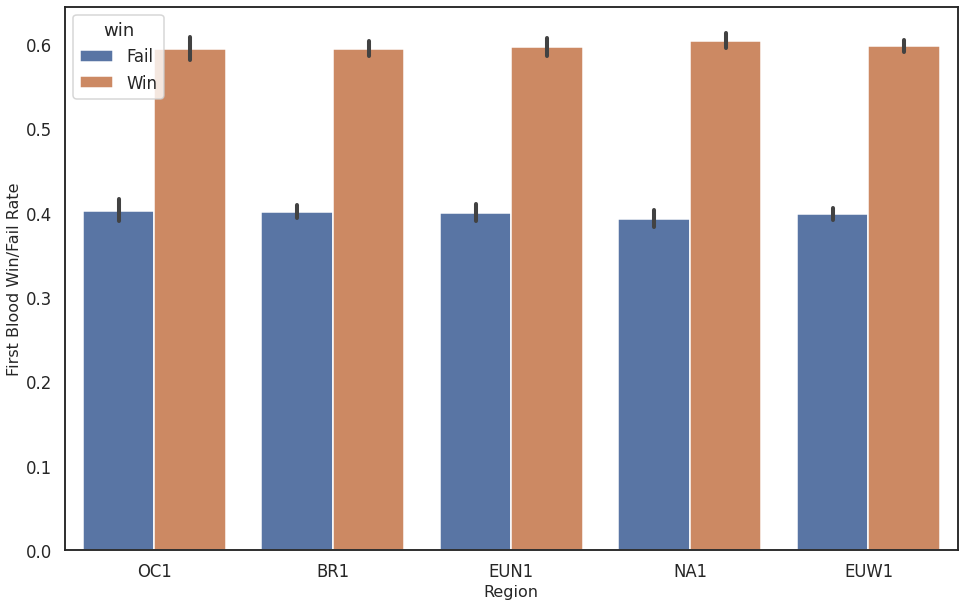 Figure 4: First Blood Win vs Fail for different regions
The last analysis we are going to perform is the average game length. Using the data of all the matches we fetched for game version 10.13 played on Summoner’s Rift and in solo 5v5 games we find that, independent of the region, the game duration is approximately close to 30 minutes. We also find the interesting phenomenon that shortly after it is possible to surrender a match, more matches end, which indicates that teams already consider it lost after just 15 minutes into the match. But as we are able to predict the outcome of a game with just 10 minutes of data, those players may indeed be right that they consider the match lost already after just 15 minutes into the match.
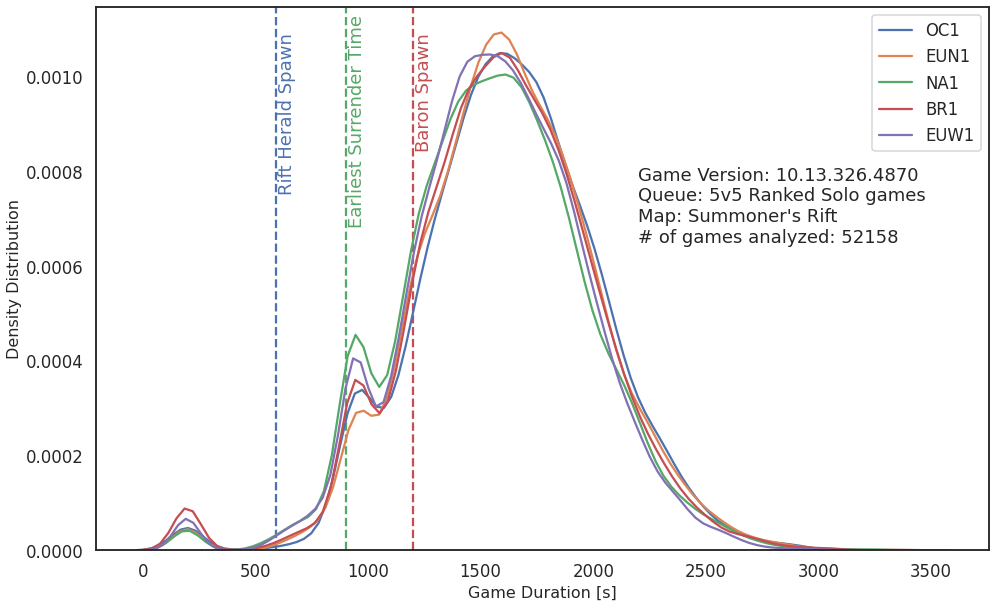 Figure 5: Distribution of game length for various regions
References
[1] Chen, Tianqi, and Carlos Guestrin. “XGBoost.” Proceedings of the 22nd ACM SIGKDD International Conference on Knowledge Discovery and Data Mining (2016), https://arxiv.org/abs/1603.02754.
[2] https://matplotlib.org/
[3] https://numpy.org/
[4] https://pandas.pydata.org/
[5] https://pymongo.readthedocs.io/en/stable/
[6] https://seaborn.pydata.org/
[7] https://scikit-learn.org/stable/
[8] https://xgboost.readthedocs.io/en/latest/